Who’s who in upstream caching
Well, once again there is too much other stuff to work on and my last blog project didn't turn out quite the way I hoped, so there hasn't been a recent blog post. Look for a few concerning my latest project in the coming weeks, but for now I'll be putting up a few shorter or less technical ones about various subjects that I'd like to brain dump. Today, that subject is upstream caching, hints in the HTTP headers that developers can give to routers and content delivery systems that intermediate between client and server.
Given a particular website or web service, the original developer generally has the best idea of how often different sorts of information are updated on the site. It might be the case that the content is updated in a matter of minutes, days, or maybe once in a blue moon. At any rate, it can be pretty costly for the server's bandwidth if it constantly has to send the client information that the client has already seen. Therefore at any point in between the connection between server and client, whether it is through a proxy or a router, there may be some caching done to save bandwidth. But for a website serving private information, the possibility of a shared cache presents a clear risk to the privacy and security of the service. Therefore, services can add directives to the HTTP headers in a response to determine how the response should be cached.
I was curious about these particular headers and how often they are used in the wild. Thanks to alexa, I was able to download a CSV of the top 1 million websites accessed by their users. As a sidenote, that is really awesome that Alexa makes this data available in a developer-friendly format, way to go guys! At any rate, it was time to test my theory that websites at greater scale (more popular) would be more likely to have customized this upstream cache, particularly to include values for a stale timeout. To do this, I created a simple script to return the cache-control header from a request:
def check_cache(url):
 req = urllib2.Request(url)
 req.add_header('User-Agent', 'Mozilla/5.0 (Macintosh; U; Intel Mac OS X 10_6_4; en-US) AppleWebKit/533.4 (KHTML, like Gecko) Chrome/5.0.375.126 Safari/533.4')
 opener = urllib2.build_opener()
 try:
  resp = opener.open(req)
  if 'cache-control' in resp.info().dict:
   return resp.info().dict['cache-control'].replace(" ", "").split(",")
 except Exception:
  return []
 return ['none']
The reason for the spoofed user agent header is that some popular websites block python's native user agent header. Some websites might also not have a public facing homepage, so for those we will not assume anything. For everything else that does not have a cache-control header, we'll return a list of 'none'.
Well, we have our list of top websites from Alexa and a method to get individual keys for a website. The way I broke up the findings was by taking the websites 50 at a time and simply adding together their key counts. Admittedly there are a few caveats to this method, one is that websites operated by a single company under different countries show up as different domains, even though it is likely that they use the same caching policy.
To run the script, I used the run method which gathered results for every 50 websites.
CHUNK_SIZE = 50
CHUNKS = 20

def get_next_chunk(f):
 cache_freq = defaultdict(int)
 for i in range(CHUNK_SIZE):
  s = f.readline()
  url = s.split(",")[1].strip()
  print "Reading:", url
  for key in check_cache("http://" + url):
   cache_freq[key.split("=")[0]] += 1
 return cache_freq


def run(skip = 0):
 f = open('/Users/Calvin/Downloads/top-1m.csv', 'r')
 for i in range(skip):
  f.readline()
 results = []
 for i in range(CHUNKS):
  freq = get_next_chunk(f)
  results.append(freq)
 return results
Add in a nice simple plotting script and we're ready to see the results:
import matplotlib.pyplot as plt
import numpy, random

def plot(results):
 ind = numpy.arange(CHUNKS)
 width = 0.1
 fig = plt.figure()
 p = fig.add_subplot(111)

 # Define lambda functions for map/reduce
 key_map = lambda x: x.keys()
 key_reduce = lambda x,y: set(x) & set(y)
 unique_keys = reduce(key_reduce, map(key_map, results))

 colors = dict([(key, (random.random(),
        random.random(),
        random.random())) for key in unique_keys])
 legend = dict()

 for key in unique_keys:
  key_counts = [result[key] for result in results]
  legend[key] = p.plot(key_counts, color=colors[key], lw=4.0)

 p.legend(tuple([legend[key][0] for key in unique_keys]), tuple([key for key in unique_keys]))
 p.set_title('Cache-Control Keys by Top Sites')
 p.set_ylabel('Frequency of Key')
 p.set_xlabel('Website Groupings')
 p.set_xticks(ind+len(unique_keys) * width / 2.0)
 p.set_xticklabels(tuple([str(i) for i in range(1050)[50::50]]))
 plt.show()
There we have it, let's check out the results of the caching for the top 100 websites:
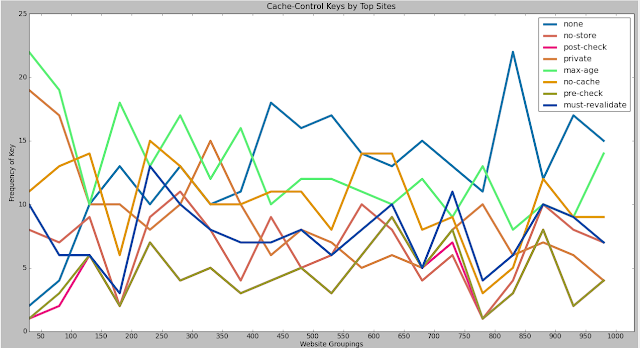
A few things become clear here, although the granularity is a bit rough. If I wanted to wait through querying 1000 websites again I might have increased the amount of saved data. At any rate, from this graph we can see a distinct downward trend in the max-age key and the private key, keys which regulate how long items remain in the cache and whether they can be shared among connections. The sites with keys also drops, as we see the 'none' key steadily rising. Clearly the sites needing the most performance take the most care in their upstream caching while those that can afford to be more lax do not take these caching measures. It's interesting to see breakdowns in individual sites - Amazon is a notable exception to this rule, a site without an outbound caching policy despite its size and scale. Perhaps they are doing something more interesting by specifying a no-cache policy if a user is authenticated, but intentionally leaving anonymous users an optimized site experience.